
📘 Frequently Asked Questions (FAQ)
For PriceLineCrossDetector & ThomasWadePriceAction Strategy
Do you offer a live demo or walkthrough?
We currently don’t offer live 1:1 demos, but we’ve created detailed walkthrough videos for each tool that serve as self-paced demos.
📺 These videos are available in the How-To Articles/User Guides section and cover concepts, use cases, and setup.
Are there videos to learn the Thomas Wade Price Action methodology?
We do not provide tutorials on the method itself. However, Thomas Wade has created a free course that explains his approach to price action trading without relying on indicators.
🎓 You can watch it here: Free Price Action Course by Thomas Wade
Do the two tools work together?
Not yet. Currently, the PriceLineCrossDetector and ThomasWadePriceAction Strategy operate independently. However, we are working on integration so that the strategy will respond to line-crossing events from the detector.
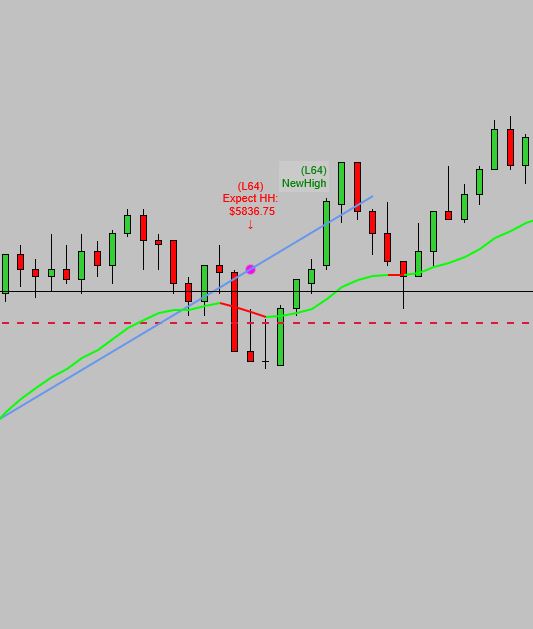
What is the PriceLineCrossDetector?
The PriceLineCrossDetector is a custom NinjaTrader 8 indicator designed to detect when price crosses user-defined trendlines. It helps traders determine when a trend may be weakening or ending, particularly after a retest of swing highs or lows labeled as New High or New Low. This tool can provide early warnings of potential reversals or confirmations of trend continuations.
How does the indicator handle trendline breaks and trade blocking in Price Action and 2-Legged structures?
When an ascending trendline is broken by a bearish move—meaning the price closes below it—the PriceLineCrossDetector marks the most recent swing high prior to the break. A horizontal arrow is drawn at this level (called CrossDownArrow), signaling a potential retest zone.
To maintain structural discipline, short entries (2ES) are temporarily blocked until price returns to retest that swing high. This rule accounts for the possibility that the bullish structure remains valid, despite the break.
In some cases, a long entry (2EL) may still become valid even after the trendline is broken, but only under specific structural conditions:

- After the break, price must pull back further—rather than immediately resuming upward.
- A new descending trendline is formed from the pullback structure.
- A long entry becomes valid only if:
- Price breaks above this descending trendline (a bullish break of the pullback), and
- Then retests the lowest swing low crossed by that trendline.
This sequence confirms that the pullback has likely ended and revalidates bullish intent. If successful, the long aims to retest the swing high that followed the original trendline break.
This logic prevents premature entries and ensures that every trade aligns with market structure. It enforces confirmation through:
- ✔ Valid trendline breaks
- ✔ Retests of relevant structural levels
- ✔ Respect for natural market rhythm (Impulse → Pullback → Continuation)
The goal is to help traders avoid trades taken in uncertain or choppy conditions, and instead focus on high-quality, confirmed setups.
What is the criteria to establish a price crossover of the user-drawn line?
For a bar to qualify as a valid crossover, both its open and close must be on the opposite side of the user-drawn line. This ensures that the crossover is not just a wick or partial movement, but a confirmed price shift.
Should I enable 'calculate on each tick'?
Yes. It ensures real-time responsiveness.
Can I customize the indicator colors?
Yes, via NinjaTrader properties panel.
What does "NewHighAttempt" or "NewLowAttempt" mean?
This signal indicates that price approached a previous high but didn’t break it. You can adjust the number of ticks considered “close enough” in the settings. Set it to 0 if you want no tolerance at all.


What is the ThomasWadePriceAction Strategy?
The ThomasWadePriceAction Strategy is a visual toolkit that highlights actionable price patterns based on Thomas Wade’s methodology. It aims to simplify the identification of market structure and potential trade setups through visual cues on your chart.
📘 For a complete walkthrough of how to set it up and use it, check the official User Guide for the Thomas Wade Price Action Strategy.

Should I enable 'calculate on each tick'?
No. Use 'On bar close' for performance with the Strategy.
Why doesn't the strategy save after closing NinjaTrader?
By design, NinjaTrader does not persist the active state or logic of a strategy after you close the platform. When you reopen NinjaTrader, the strategy needs to be manually re-enabled, even if it appears attached to the chart.
✅ To make this easier:
- Save your chart with the strategy inside a workspace (Workspaces > Save As).
- Use the Start Behavior setting like
ImmediatelySubmitif you want it to activate without waiting for a new bar.
🧠 This behavior is intentional and helps avoid unwanted trades being triggered when reconnecting live data.
I can only view one F2S on my screen. What happened to the rest?
This likely means the number of markers is limited in your settings.
📌 To fix it, increase the value of Max Markers Shown in the indicator’s Filters section. Set it to 10 or higher to see more F2S/F2L markers on your chart.

Why didn’t a 2EL show up?
Could be due to filters like inside bars or EMA distance.
What does it mean when an entry like 2EL/2ES or F2L/F2S is bright or dimmed?
Bright markers mean the setup was detected and it remains valid based on your current filters and rules (for example: inside-bar rules, EMA filters, bar-size limits, trend/counter-trend blocks, time filters, etc.).
Dimmed markers mean the setup was detected, but it was disqualified by one or more filters. In other words, the tool is showing you: “this is where a setup would have appeared, but it was blocked by your settings.”
This is useful for learning and review, because you can see both valid entries (bright) and filtered-out entries (dimmed) and understand what rules prevented the trade.

What are the gray bars that appear on the chart?
The gray bars represent overlap zones — areas where the high and low of a bar are entirely within the range of the previous bar. These bars are often referred to as inside bars in price action terminology.
They typically indicate temporary indecision or consolidation and are automatically detected by the strategy as part of the setup logic.
While not signals by themselves, they can affect whether some setups (like 2ELs or 2ESs) are valid, depending on your filter settings.
🔧 You can enable or disable gray bars in the strategy’s visual options.

I’m not seeing any markers. What now?
Check chart type, visibility, and filters.
How can I report bugs?
Email us or use the contact form.
Why do I get "file exists" when importing the TW sound pack?
This message appears because the sound files were already included when you installed the TWPriceActionStrategy, or another strategy developed by us (such as Bob Anderson's), which also includes the TW sound files.
You don’t need to import them again — they’re already available in your system.
📁 You can find them in: Documents\NinjaTrader 8\templates\sounds\
Some of the relevant files for TWPriceActionStrategy include:
- SecondEntryLong.wav
- SecondEntryShort.wav
- FailedSecondEntryLong.wav
- FailedSecondEntryShort.wav
- HigherLow.wav
- LowerHigh.wav
- Potentialxx2EL.wav
- Potentialxx2ES.wav
Note: In Potentialxx2EL and Potentialxx2ES, xx refers to the instrument symbol. For example, PotentialES2EL refers to a potential long setup on the ES instrument.
🗣️ If you'd like to change the voice or message in any sound file, you can do so using free online tools such as VoiceGenerator.io or TTSMP3.com. Simply export the audio in .wav format if allowed or write the text and replace the original file — but be sure to keep the filename exactly the same.
🔇 If you’re not hearing alerts, ensure that sound notifications are enabled globally in NinjaTrader under Tools > Options > General > Sounds.
ℹ️ Other sound files in that folder may belong to different strategies. It’s safe to leave them there to avoid conflicts with other tools you might be using.
My computer freezes when I reload the NinjaScript or the TWPricelineCrossDetector indicator. What should I do?
This usually happens when too much data or too many graphical objects are loaded into a chart. It can also occur if the chart has become corrupted due to accumulated or inconsistent drawing objects.
To fix or prevent freezing:
- Force close NinjaTrader: Press
Ctrl + Shift + Escto open Task Manager and end the NinjaTrader task. - Hide the indicator before connecting: Set the property
Visible = falsebefore reconnecting. Re-enable after NinjaTrader is fully loaded. - Reduce chart load: Use fewer days of historical data, minimize the number of drawn lines, and avoid excessive chart objects.
If the chart appears corrupted or continues to freeze:
Sometimes NinjaTrader stores invisible or inconsistent graphical objects that interfere with loading. The most effective solution is to delete the affected chart and create a new, clean one using a fresh template.
To clean up strategy-related issues after a crash:
- Go to the Strategies tab in the Control Center.
- Right-click any strategy that remains listed after a crash and choose Remove.
- Restart NinjaTrader before opening new charts or applying any indicators.


Taking these steps helps ensure NinjaTrader starts with a clean environment and avoids freezing on load.